
Currencies
The Currencies report in the Reconciliation section provides insight into how your transactions are distributed across currencies. It breaks down both the count and value of received, approved, and declined transactions, giving you visibility into currency-specific transaction volume and outcomes.
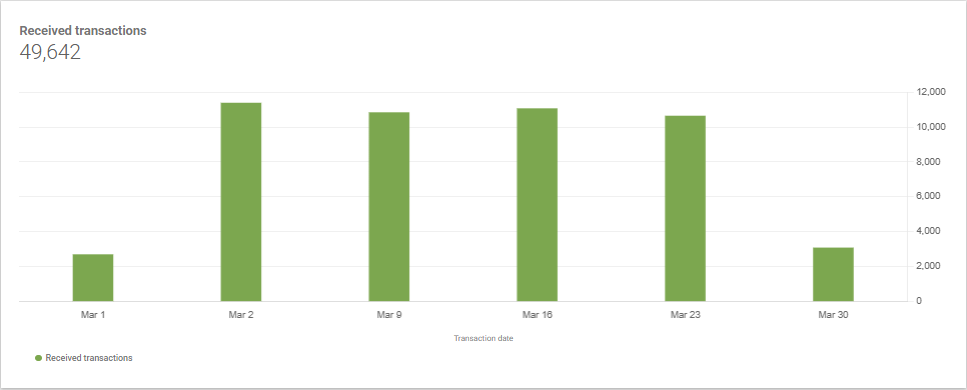
At the top of the report, a bar chart displays received transactions over time, segmented by week or month depending on the selected date range. The vertical axis represents transaction volume, and each bar reflects the total number of transactions received in that period.
Use the filters at the top of the screen to change the date range, isolate specific transaction types (Authorize, Capture, Charge, Refund, Void), or focus on a particular company.
Below the chart, a summary table presents two views:
- Count: The number of transactions received, approved, or declined per currency.
- Value: The total monetary value associated with each of those transactions.
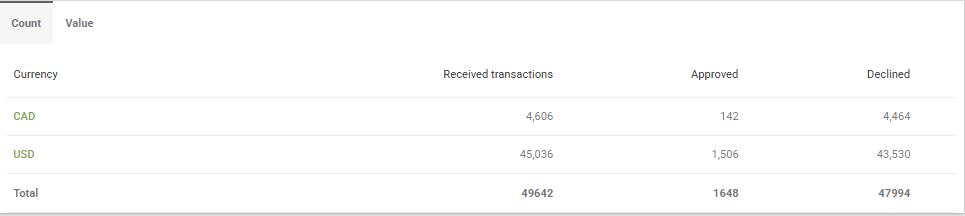
Each row in the table corresponds to a currency, while the columns provide a breakdown of:
- Received transactions: Total number of transactions processed for that currency.
- Approved: Transactions that were successfully approved.
- Declined: Transactions that were declined by the processor.
The totals across all currencies are provided in the last row for quick reference.
Details View (Currency Drilldown)
Clicking on any currency in the summary table opens a Details view, which shows a breakdown of that currency’s transactions over time.
The chart displays received transactions for the selected currency only.
The table below breaks down received, approved, and declined transactions by week or month, depending on your selected date range.
This drill-down view is useful for identifying trends or anomalies within specific currencies, especially when comparing periods of increased decline or approval rates.
Updated 7 months ago