
Recovered Customer Retention
The Recovered Customer Retention report provides a visual breakdown of how long recovered customers continue to generate value after a failed payment is successfully recovered. By tracking each recovery cohort over time, this report helps you understand the duration and consistency of retained revenue at the customer level.
By default, the report shows data from the last 12 months, and all values are converted to USD. You can filter the report by company or currency using the controls in the top-right corner.
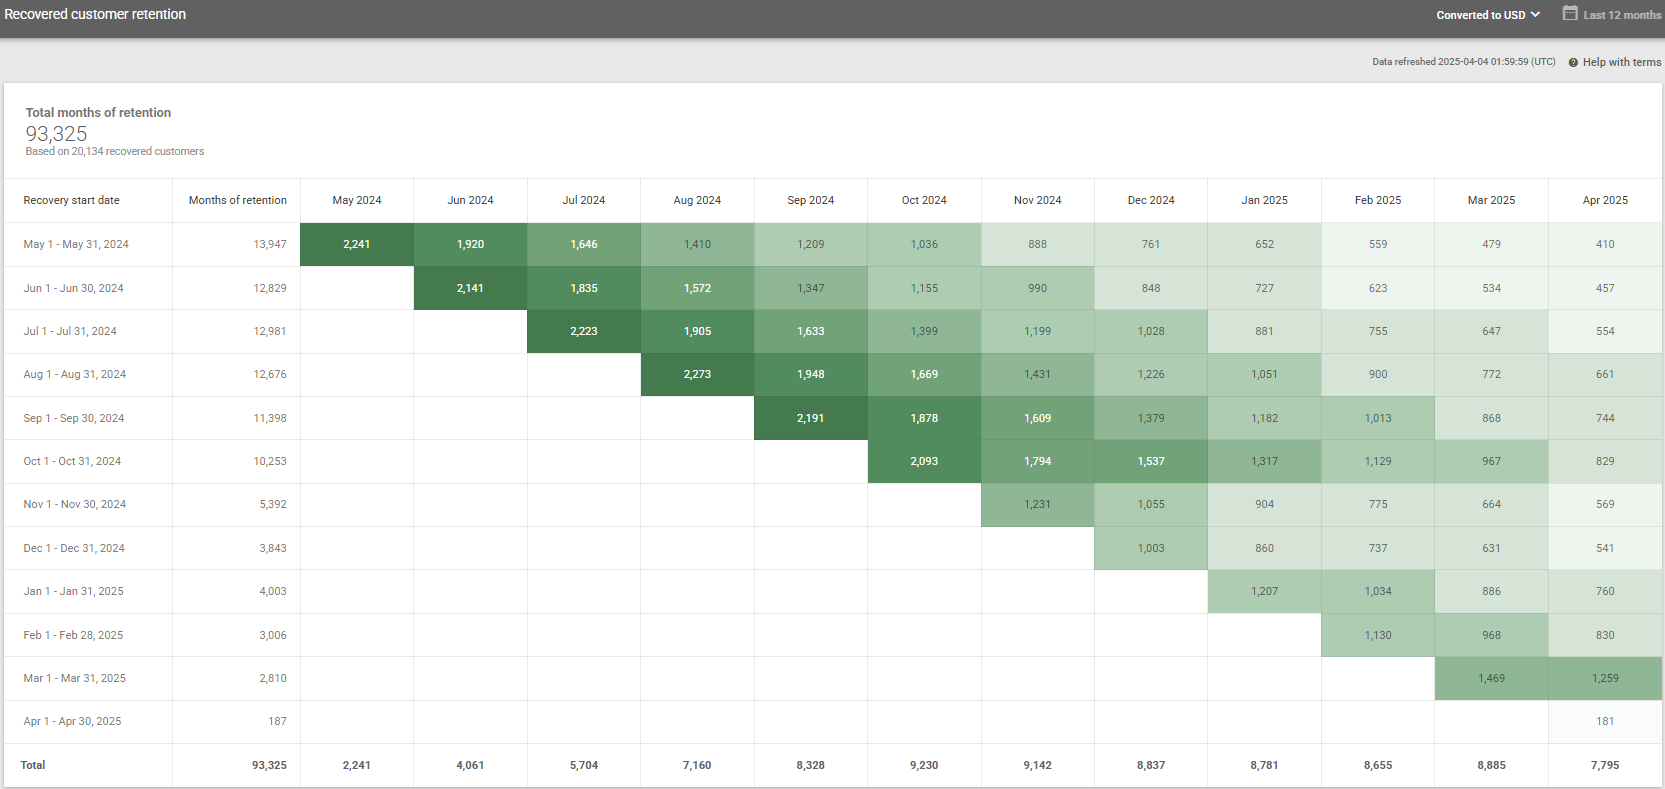
A heatmap-style table illustrates how recovered customer cohorts are retained over time, with the recovery in the first month and subsequent rebills estimated based on customer lifetime. Each row represents a recovery cohort (customers whose payments were recovered in a given month), and each column represents a monthly rebill.
Key Elements:
- Recovery Start Date: Indicates when the cohort’s failed payments were recovered.
- Months of Retention: Shows the total number of recovered and retained monthly rebills for the entire cohort. This is the sum of all the values in that row.
- Monthly Columns (e.g., Jan '24, Feb '24, etc.): Each cell shows the estimated number of customers from that cohort who are still being billed in a given calendar month. The first month representing the recovery is based on observed data; all subsequent values are modeled estimates based on expected customer lifetime.
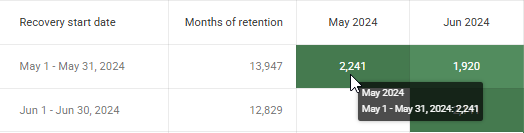
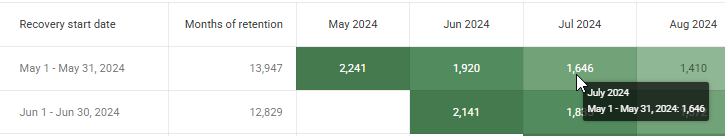
When you hover over a specific cell in the chart, a tooltip shows the number of customers from a given recovery cohort who are retained in a specific calendar month.
- The value shown when hovering over the recovery month (e.g., May 2024 for the May 1 – May 31, 2024 cohort) shows the actual number of customers recovered during that period, based on observed data.
- The values shown for subsequent months (e.g., July 2024 for the May cohort) show the estimated number of customers being rebilled from that original cohort still active in that month. These values are modeled using customer lifetime, with a simulated natural probability of a customer churning in a specific month.
Important
The charts only include cohorts whose recovery started within the last 12 months. Any projected value from earlier cohorts is excluded.
The projected value is only displayed up to the current calendar month. Any value expected beyond the current month is not shown in the charts
Updated 6 months ago